
Yet we know (yes, we do) that these are bad choices for conveying information. Our job as dashboard builders is to create a cohesive and accurate information message that can stand alone in a room without us there to interpret.
While these charts may be our secret guilty pleasure, for many of the managers, directors and vp's, these are the standard charts they're used to and that they want to see. You will spend days building the perfect dashboard and then in the final meeting someone will tell you that it's nice, but... they "just want to see" a pie chart (or bubbles, or stacked bar) showing....yada, yada, yada.
My advice is to head them off at the pass. Put a pie chart or bubble on the dashboard at the start. But use it as a filter or design element. Pick a main dimension field with very few categories. If it has 2-3 use a pie chart, if 3-5 use a bubble chart. But don't use one with more than 5 categories, even that may be pushing it.
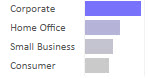 Here's an example using packed bubbles as a filter. The reason packed bubbles are considered 'bad' charting is because we have trouble discerning and comparing the sizes of the circles. A sorted bar chart would do a superior job of instantly communicating the difference between categories, but for some reason they don't delight. Bubbles delight.
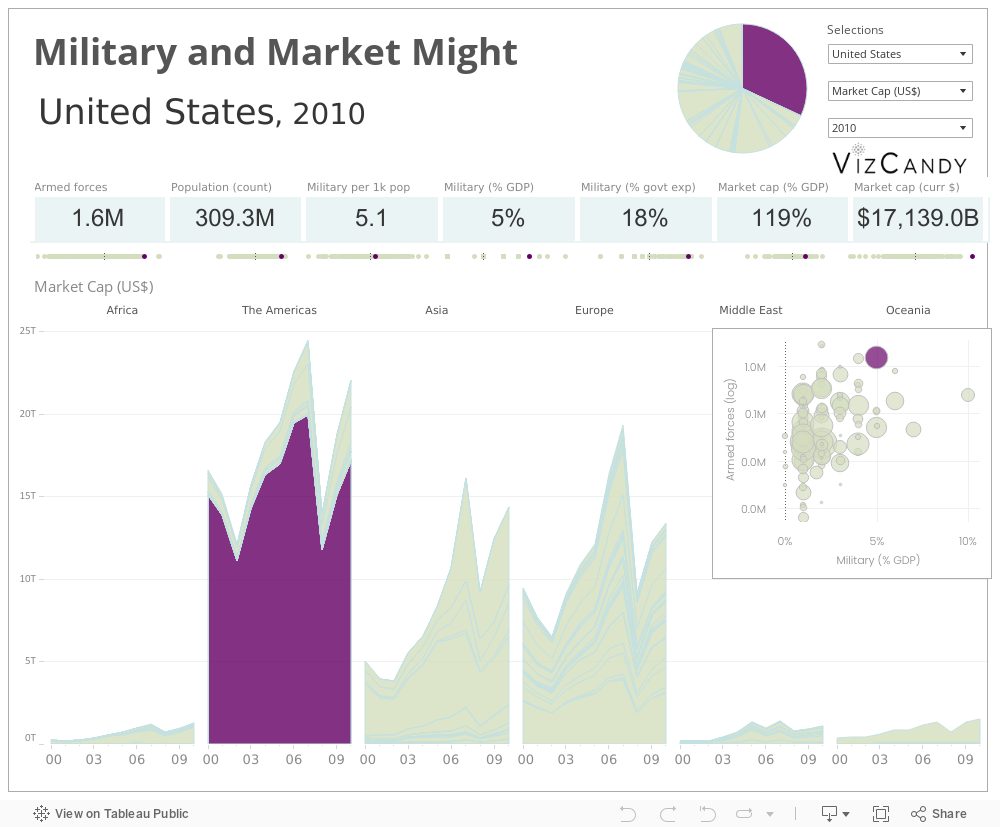
The tool-tip does provide the % value for each slice, but it is really intended just to give a sense of the place of the chosen country in relation to the rest of the world. Choose a less wealthy country and you'll discover one of the dreaded dangers when using pie. You never know when one of these will turn up (_|_) and everyone in the meeting will start giggling.
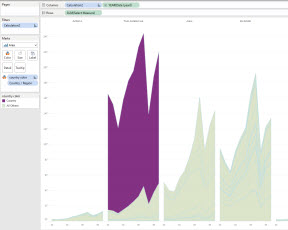 I've also used the semi-bad stacked area chart. Using it with the country dimension makes it impossible for the user to figure out the real changes occurring for each country. In this case, I've used it to show the total trend for each region and to highlight one country in comparison to the rest of the world.
 I've set the selected country to display against the 0 axis, rather than in order of size or name. Can you see the difference? This is the problem with all stacked trend area or bar charts. You can really only tell what is going on with the category at the bottom.
Cheers!