Shapes for Labels
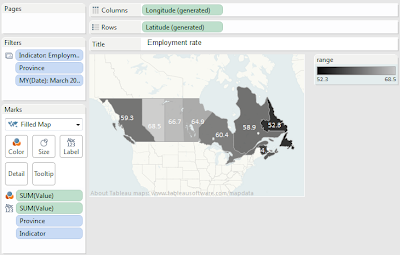
Sometimes showing labels doesn't work because of the shading ranges as with this map. Applying black font won't show on the provinces with the lowest employment rate and a grey font won't show on the other provinces. To fix this, I used a dual axis map and for the second axis, I've used a blurry image as a shape file. To recreate this:
1. Create a filled map
Drop the value pill on the color shelf Select the color range you want
Drop the value pill on the label shelf
Click on the Label option and select
'Show mark labels'
Format the labels
2. Create a second map and add shapes
Add another Longitude pill to the columns shelf to create the second map. Select Shape.
Right click on that second Latitude pill and select 'Dual Axis'. This will place the map with your shapes over the first map.
Shapes for Filters
Using button shapes for filters are quite handy because most people are familiar with them and you don't have to put the instructions on the dashboard.
This is very simple to create.
Place this view on your dashboard and set it as the filter for your other views.
Get the images from this workbook
I've created a number of different colored buttons to use as filters and some other shapes and arrows with transparent backgrounds. You can save these shapes to your Tableau Shape folder for re-use. These are not professionally created, so the resolutions won't hold for all sizes, but they work in a pinch. Plus they're free from me to you.To get the images, first download the workbook at the bottom of the post. Open it and save it to your Tableau Workbooks folder.
When you open a packaged workbook, the program saves the extract and image files to your Temp folder. To find it, take the workbook out of Presentation mode.
Right-click on any view and select Go to Sheet.
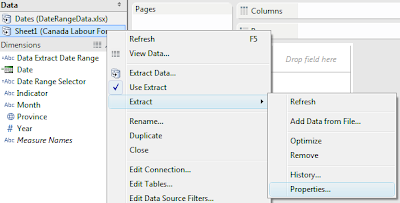
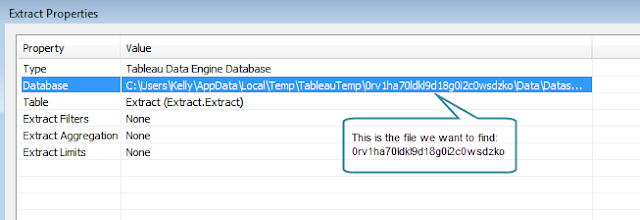
 Now right-click on one of your data sources, select Extract, then Properties.
This will tell your where Tableau has dropped the workbook and all the bits packaged up in it. You may need to set your folder settings to show hidden folders.

In this folder you will find a .tde of your Tableau workbook, the data source(s) and a folder containing the images in the workbook.
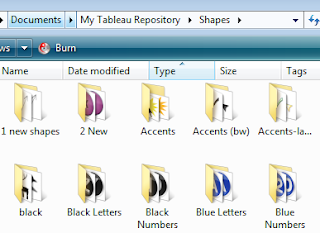
 You can copy these to a new folder in your Tableau Repository Shape folder. You should also save them to your Pictures folder to add them to dashboards.
All of these images are hand drawn by me, so you are free to use them for any purpose.

Smashing Magazine has lots of design ideas and lists of open-source icon sets that you can use for non-commercial use.


