It's winter in Vancouver, which means it's the grey season. This is the time of year that I watch more tv than is healthy and unfortunately, this is the time of year that tv is focused on the reality of badly behaving humans or awards shows. When I watch tv, I want some fiction, some laughs, some fantasy. When I want reality, I go outside and hang with humans who fortunately act nothing like those on reality tv.
 For inspirational reality (other than family and friends of course), I tend to go to TED or YouTube. Here's a bunch of great talks I've seen in the past few months that have inspired me or given me hope for humanity.
Richard Thaler's lecture at U California on government regulation, the financial crisis, the Gulf oil spill and nudging.
Thaler is a behavioural economist and the co-author of Nudge: Improving Decisions About Health, Wealth, and Happiness, with Cass Sunstein. I haven't read it yet, but it's on my wish-list and having seen this brilliant video it may push Geekenomics down the list.
How to help people kick-ass with open data - Kathy Sierra, Creating Passionate Citizens (14 minutes).
Kathy proposes that it's just as important to create a killer user as it is to create a killer product; to build the things that inspire people to develop their passions.

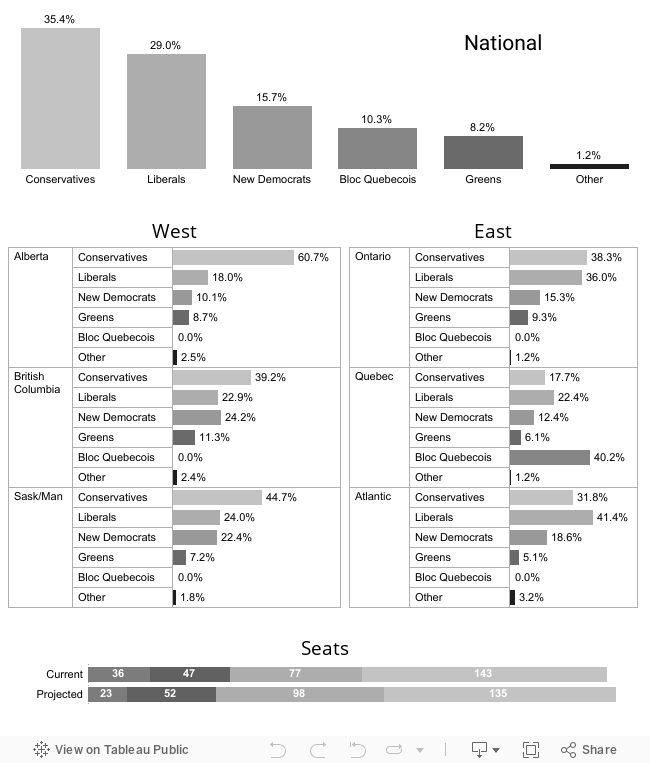
Journalism in the Age of Data: a video report on data visualization as the storytelling medium.
This is an 8 part video report (approx 1 hour) on how journalists are infusing their stories with sophisticated on-line, interactive analytics and the tools they're using.
Amanda Cox has produced some of my favorite viz's over the years, so I was particularly happy to see her interviewed here. Also, Tableau is mentioned.
This was a great talk by David McCandless, illustrating some terrific ideas for visualizations and dashboards in health care.
Wouldn't it be nice to go on-line and see your test results presented visually with the appropriate thresholds identified?
Hopefully these individuals are inspiring CEO's, directors and managers to ask more from their reporting analysts with questions like:
Why can't you make this report tell me a story like [X] did in the New York Times?or
There's a great api on my phone that dashboards my stock portfolio, why can't our reports be that clear?