The funny thing is that 'Drill Down' is just the opposite. People ask for it - make a big deal of it - in dashboard building, not realizing that this is a simple thing in Tableau. There's a few ways to provide the 'Drill Down', but it's important to first ask what exactly do they mean by 'Drill Down'. Usually, it's one of three things:
 Most Common Meaning
Most often, people are asking for a dashboard or series of dashboards that provides charts and information going from overview to detail. Easy peasy.A Pivot Table
This is what they're used to seeing and they are afraid that they won't recognize the numbers, or be able to check the numbers, or not have a means to get at the detailed numbers they may need on an ad-hoc basis.There's a simple solution to this... build your dashboards as you would logically, to visually make sense of the information and communicate it.
Then create a dashboard that has one big ole table on it and a bunch of filters. The people that are comfortable with this mode will be satisfied and hopefully in time, they will have confidence in the dashboard numbers.
All The Data
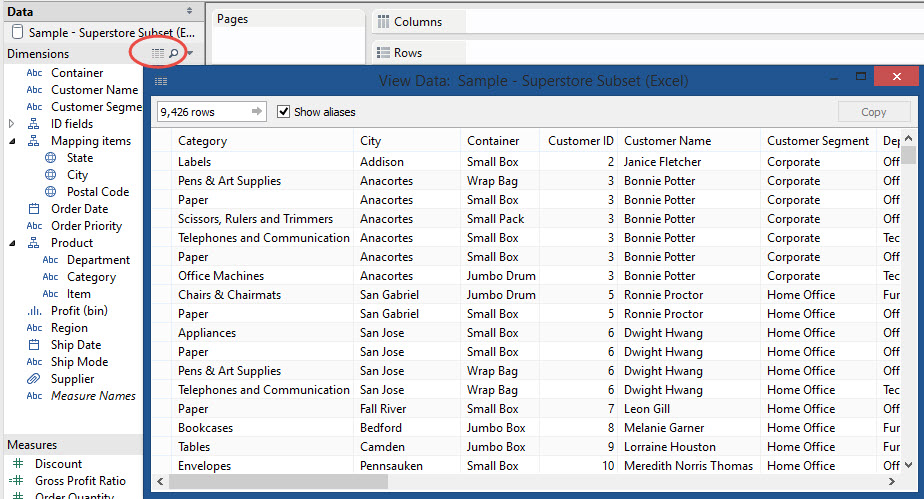
This is similar to the pivot table request above although it usually comes from an analyst. They are accustomed to being blocked from data. Period. They often want all the data so that they can export it out to check or do more analysis in Excel. For new Tableau users, they just don't realize that all the data is in there for them to access and they are leary of your promise that they have access to all the data.
Show them how they can view and copy out all the data in the data source internally.
Or show them how they can view and copy out all the data in a chart or table from the dashboard.
Or simply send them the link to this post, so that you can be sure you both know what kind of 'Drill Down' you're talking about.
ps. For some more heinous visuals, check out google 'drill down'. Seriously BI, you've got some explainin' to do.
Cheers!


