
Happy Holidays!
Here's a few, very simple, free tools that will help make your
dashboarding work just a little easier. Click on the images to
go to the respective sites for download.

1 Tableau Data Reshaper Add-In
Reshapes your table data, UnPivots, fills in values and opens your data in Tableau.

2 XL Tools
This is a great little add-in that has data cleansing and cell combining features.
3 Federal Reserve Bank of St. Louis Economic Data (FRED) Add-In
Very handy for up-to-date US data and some International data.
4 ColorPic
See a color you like - grab it with this tool and enter the RGB values in your custom colors or add the HEX to your Preference file.
 5 Color Brewer
Very valuable advice and handy map color palettes.
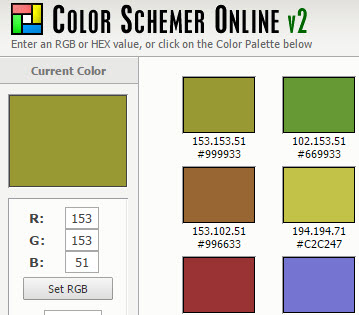 6 Color Schemer
Great for creating color palettes and then 'export to text' allows you to quickly copy/paste the HEX values to your Preference file.
7 Images
1,000 basic black and white images. Actually only 200, but in 5 sizes, which is great as you then don't have to worry about image distortion.
 8 Death to the stock
These aren't typical data visualization images, but they make for some nice headers or images for StoryPoints.

9 NotePad++
The best.
 10 Juice GeoCoding Tool
This odd little tool will provide you with lat/lon coordinates for addresses. Very handy if you don't have a ton of addresses. I have used it on a batch of 200 and it did just fine.