
The trick is to put the information into a tool-tip using a similar formula for in-cell graphing that many have used in Excel (Andy gives credit to the same Excel MPVs that I've mentioned on the Clever Monkey's page). To do this, you create 2 new calculated fields for each of the variables and display them inside the tool-tip. One field to calculate the % and another to use the in-cell graphing formula. Hover your cursor over a bubble on the map and the breakdown by prize type will be displayed.
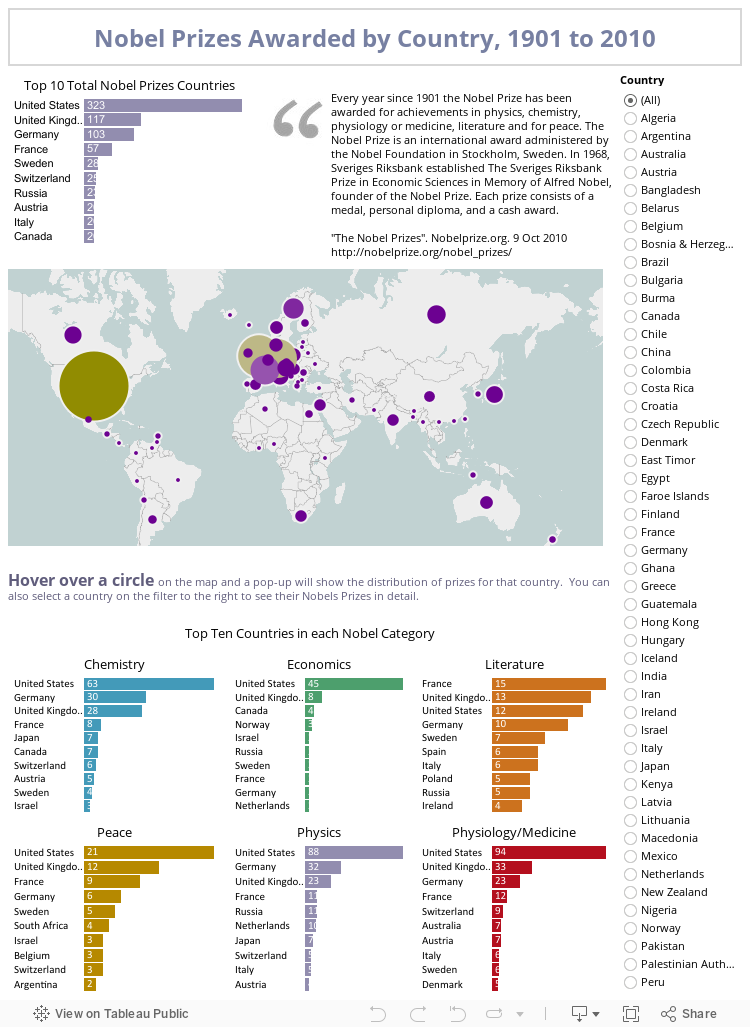
 The Nobel data was obtained from a BBC article Which Country has the best brains? Nice of them to include an .xls spreadsheet with the results. There's not a lot of data involved, but for this exercise - for me, less is more. To learn more about the Nobel Prizes, check out their site http://nobelprize.org/. There's some interesting detailed information on the Facts and Lists page.
The only difficulties I had with this exercise was in dealing with NULL values. In Tableau Public, you handle NULL values in formatting, on the Pane tab, under Special Values. I could not seem to get the numeric field to hide the value so I placed a "-" in the text field. For the text variable, which produces the bars in the Tool-tip chart, I could not seem to find a way to have the field display anything other than NULL. I'm sure there's a way to have nothing appear, but I haven't found it yet.
The formula that Andy provides includes 100 █ characters. With this data it resulted in a messed up chart if a country only had one prize awarded, so rather than multiply each % calculation by 100, I used 10 to make fewer bars present in the Tool-tip. Not mathematically accurate, but I'm not presenting the % figures on the chart.
Well, that was fun. Thank-you Andy! Now if I could only figure out how to present median times in a bullet chart (I've been wrestling with this one for weeks).