I've spent this past week working on mapping the VPD crime stats to Vancouver neighbourhoods. It wasn't as easy as you'd think. I would have liked to have used a map with the neighbourhoods outlined, however, importing the Google city neighbourhood boundary map provided through Vancouver's Open Data Catalogue into Tableau Public is beyond me at this time and I'm not entirely sure it's possible in this version of Tableau. Regardless, learning the Google Map Api and how to integrate it with Tableau will have to wait.
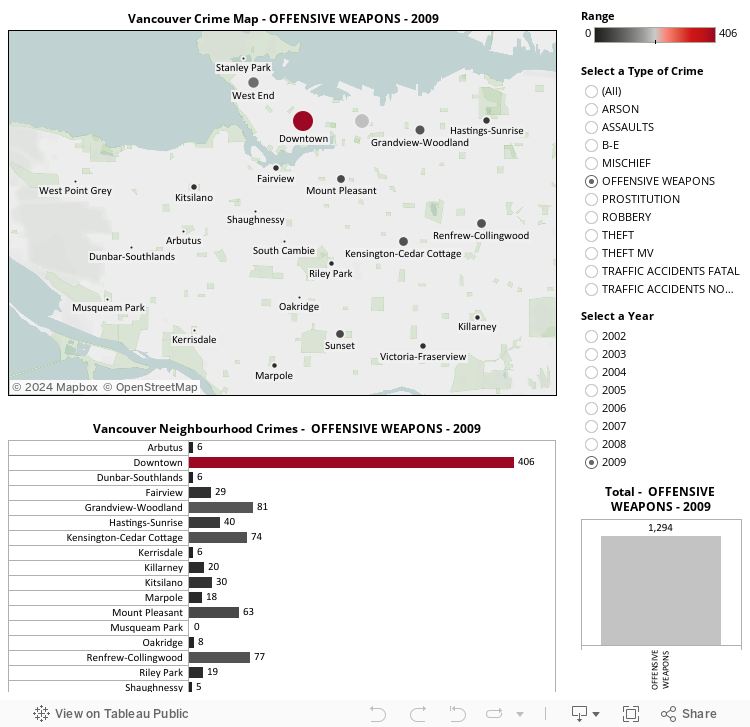
In this viz, I've left the crimes ungrouped and you can select a crime and year to view the information. Click on a spot on the map and the data is highlighted in the table below.
In order to identify the neighbourhood centres I used postal codes and longitude/latitude data for prominent city locations such as fire halls, libraries, schools, and community centres. All of this data is available on Vancouver's Open Data site. Tableau Public will automatically generate latitude and longitude values based on postal codes, just not for all of Canada and it is not possible to import the data into the 'public' version.
Other than learning how to map - that is, just getting the points to show up in the proper locations - I also played around with the visual options, learning how to adjust the color and sizing of the map points. It's all incredibly easy. I can say that now.