
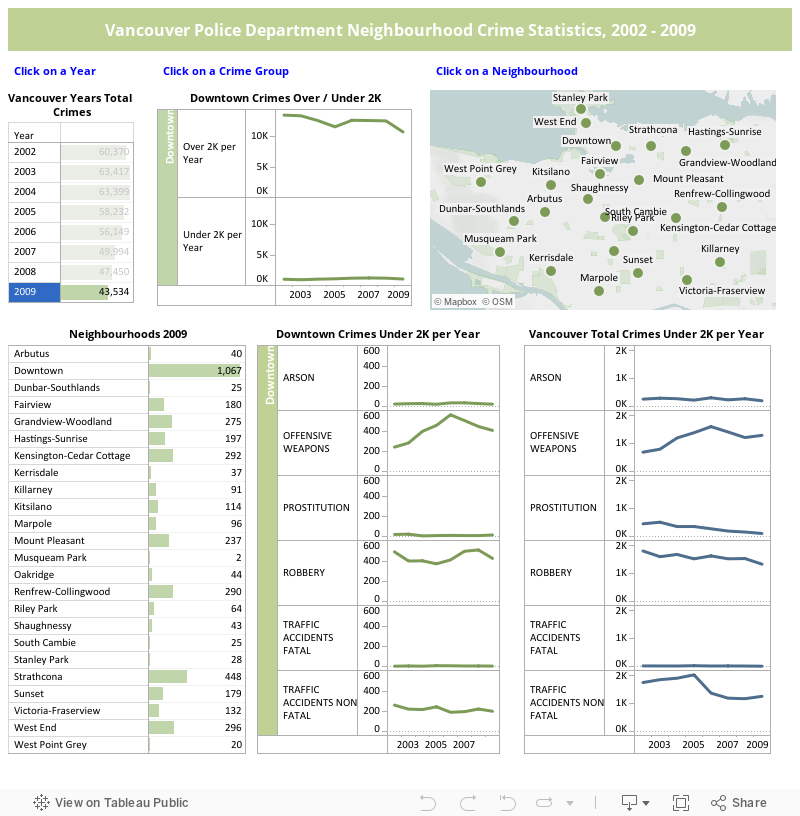
Confused? Play with the filters (you can't break anything) by clicking on a year and then a particular neighbourhood. I've created two major types of crimes based on incidence; those that are reported less than 2,000 times per year for the whole city and those reported over 2,000 times. You can filter on that grouping by selecting either trend line.
My intent with this exercise was firstly to provide all of the years' crime stats by type and neighbourhood into one dashboard in a logical and concise fashion, and secondly to learn to use the action function for filters with Tableau. This is tricky. It's important to think of all possible ways in which the user will want to view the stats. In this case, I've applied a number of actions and filtering options, which hopefully won't cause long refresh delays.
I hope that this is intuitive, clear and informative. If not, then I've got some more work to do.
Source: Vancouver Police Department Year-End Statistics by Neighbourhood. http://vancouver.ca/police/organization/planning-research-audit/neighbourhood-statistics.html