
We all like to think we're indispensable at work, but we're not. We're just not.
So get over yourself, Simon.
Have you ever built the most clever Excel dashboard/database/reporting system that you knew would keep you in the money for years?
You know you did, Simon. Yes, and it was forever referred to as the "Simon Chan Report". After the accolades, you settle in to maintain the damned thing, month after month, year after year. And it's taking up a lot of your time because it has become so complex (named ranges, linked fields, complex multi-layered formulas, vba) that any new request for change will take weeks to implement. It really has no business being an Excel report.
What usually happens with these "Simon Chan Reports" is that they get handed off to some poor analyst in another department to maintain with little or no documentation. Then guess what happens? The report doesn't work. So it gets re-built, often from scratch, which takes months or forensic-like deconstruction of the maniacally insane logic of the bloody-Simon-bloody-Chan-Report.
Fortunately with Tableau the innards are pretty transparent and it's fairly easy to figure out what another analyst has done to get the results you're seeing. But even with Tableau, there are ways to unintentionally obfuscate. So, while you're building your report, it's important to keep in the back of your mind the fact that some other analyst will have to maintain or change your workbook.
Here's some tips to consider:
Aliases
The ability to add aliases for your dimension categories is a great feature and causes no confusion that I can think of, but aliasing your Measure Names field is tricky. I often get workbooks that have a detail crosstab full of measures and dimensions. When someone has given a bunch of those measures alias's I have to dig to figure out which of the alias's matches to which measure and then remember that for every other chart that I may build.
This case isn't bad, but in the real world there can be many data sources with hundreds of measures. I've also hidden many of the shelves in this example because I frequently encounter this in others' workbooks. People hide and move things according to their personal preference. That's fine, but now I have to go through the steps to bring them back into the view so I can figure out the logic (another bug-a-bear).
A considerate analyst would leave all the shelves in view where it started, and instead of aliasing measures, make copies and re-name them. It's that simple, only a couple of extra steps; right click > copy > rename.

Captions

The Caption dialogue is one of the sweetest bits of information, it explains everything that's going on in your view.
Leave it open for other users to see information on complicated views (right-click anywhere on the grey area and add it as you would the Title).
You can also leave notes for others or explain complicated logic for yourself. We've all opened an old workbook and thought "Ooooo, that was cool. I wonder how I did that?"
This is also a great place to note the alias's that you've used.
Calculation Dialog

Frequently when I download a workbook from someone's blog, I discover that they have left notes in the formula of their calculated fields - what a pleasure. I am doing my best to adopt this practice as often as possible, especially when I am building something for clients whose analysts will use the workbooks as templates.
Comments
Put notes or copy calculations in the default comments. Right click your field > Default Properties > Comment. Then when you hover over a field the comment will display and remind you of what you did in that calculation.

Worksheet Numbering
 When you've finished your dashboard, number your worksheets and then hide them. This is also really helpful when you're in the Actions dialogue, especially if you have multiple/complicated actions. As you can see from my naming convention, I'm not fussy, but it gets the job done.
 The <Sheet Name> value almost never ends up in my titles.
Tidy Up After Yourself
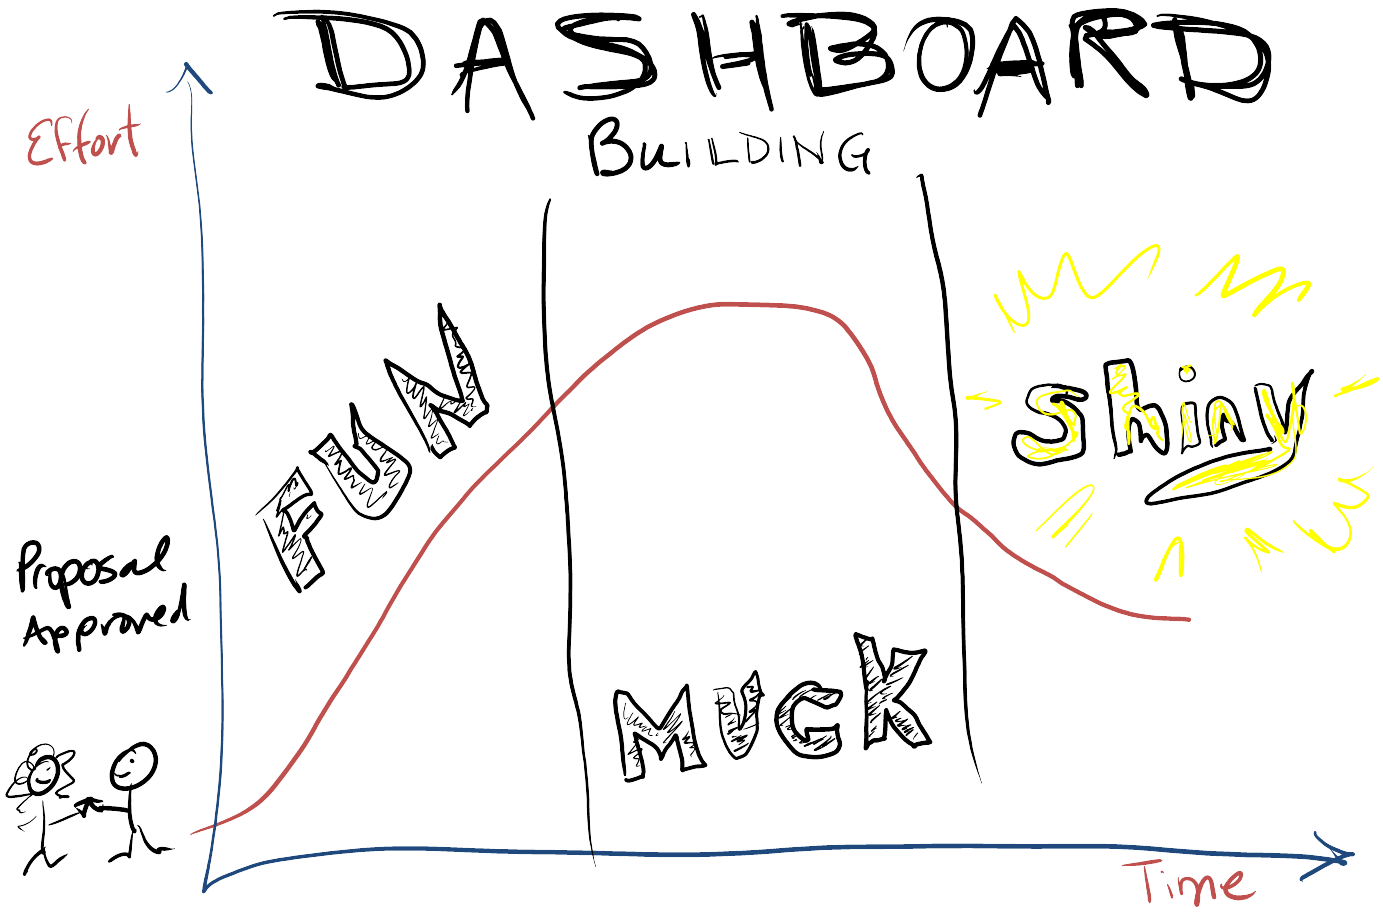
I think almost all work has 3 stages; fun, muck, and shiny. With dashboard building, initially it's so much fun getting into the data, making charts, seeing what's there, hitting the Show Me over and over, digging in and finding the gems.
Then the muck starts. You slow down, you have 75 worksheets and now you to deal with inter-dependent logics, arranging all the pieces into a cohesive and interactive narrative. It's not that rolling around in the muck isn't fun, but it takes some careful consideration.
Suddenly it starts to flow. Everything is coming together almost magically, you fine tune and tweak, mercilessly kill your darlings, and add your finishing touches. This is Shiny. It's tempting to send it off the minute you've finished, to share your excitement (and meet your deadline, as shiny often occurs at 2am), but you aren't really finished are you?
This is the time to tidy the hell up.
Get rid of 'test' fields that shouldn't be used. When I'm in draft mode, building fields and testing, I'll often name these fields beginning with x (eg. [xDate Value Max]). When the field works and is in the view I remove the x. Then at the end of the project, I can easily find all the x fields and delete the ones that didn't make the cut.
I get lazy with parameters, though. As I'm often copying worksheets into workbooks to use as templates or for formulas, I sometimes forget to delete unused parameters. But deleting fields is pretty error proof - or at least you get a chance. Once you've gotten rid of unused worksheets, you can safely delete the old fields and parameters. If the field is in use on a dashboard/worksheet, you'll get a notification warning you.
Rename badly named fields, eg. Calculation 1, Calculation 2, Calculation (copy), etc. Remember, if you've left the controls on tool-tips, users will see the underlying badly (and confusing to them) field names.
Refresh your extracts and optimize them.
Customize your filters - remove all the extra controls you don't want your user to see.
Put blank text boxes over areas you don't want your user to click.
Add notes.
If anyone has any other suggestions, please let me know and I'll add it. I'm sure I haven't thought of everything.
Note: Simon Chan is completely fictional. Well, I'm sure there are Simon Chan's out there that don't feel fictional, but in this case, Simon Chan is based on an amalgamation of many different analysts with different names, who have built these types of Excel reports (myself included).